
SCIPHYR to MasterFrame Wind Pressure Values
When performing a directional wind analysis, calculating the wind across 12 distinct 30° sectors provides a highly accurate and efficient wind profile, avoiding the excessive conservatism of a single, non-directional worst-case assessment.
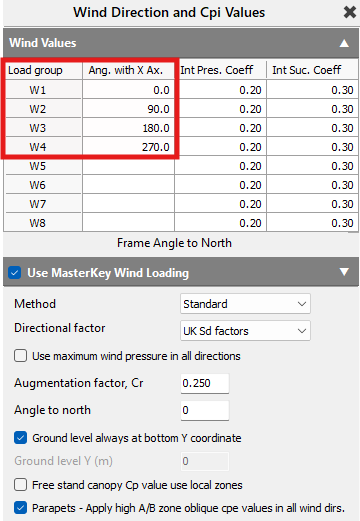
However, because the lateral resistance of most MasterFrame structures is organised along two principal orthogonal axes, these 12 sector results must ultimately be mapped and consolidated into 4 or 8 primary orthogonal directions (representing the four main building faces), i.e. W1-W4 or W1-W8. These can be amended within 📄 Wind Directions Settings (and Cpi Values).
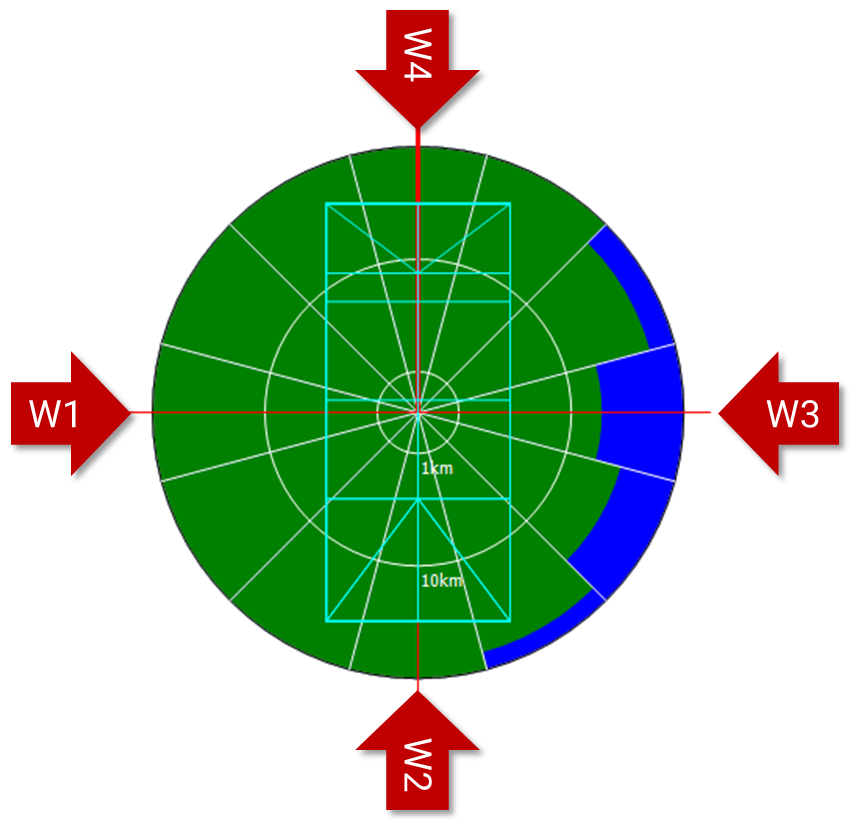
For simplicity, in the below example we will refer to W1-W4 and breakdown how the maximum wind pressures are extracted from the 12 directional sectors, to generate the design loads for the 4 building faces.
Wind Pressures
3d View
Plan View
1. Consolidating Sectors into Quadrants
MasterFrame Orthogonal Quadrants
Building Orientated to True North
SCIPHYR Sectors S1-S12

From SCI P394
To transition from 12 separate directional wind speeds to 4 orthogonal wind directions, the 30° sectors are grouped into four 90° quadrants. Ideally, the orientation of these sectors is specified to "suit the building," meaning the 90° quadrants are perfectly centred on the building's own orthogonal axes.
When the sector grid aligns perfectly with the building orientation, each 90° face quadrant neatly encapsulates exactly three of the 30° wind sectors.
2. Extracting the Maximum Pressure
For example, if a building is oriented perfectly to True North (0°), the mapping from the 12 sectors (S1 to S12) to the 4 orthogonal directions occurs as follows:
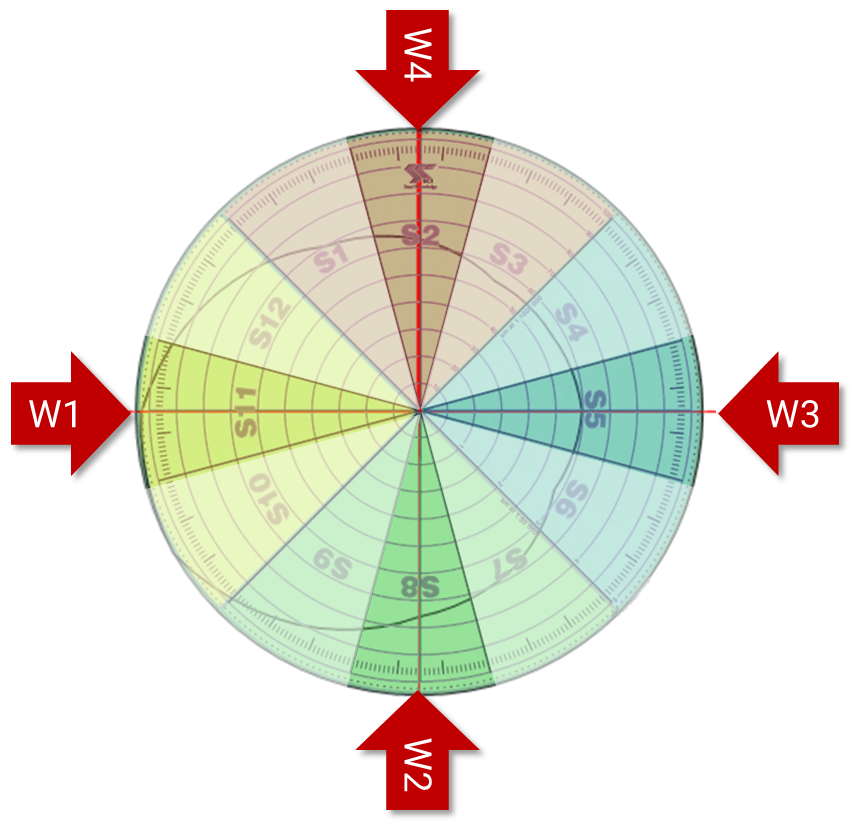
- W1 (West): The software covering 225° to 315°, and sectors
- S11
- S12 & S1 Interpolation
- S9 & S10 Interpolation
- W2 (South): The software covering 135° to 225°, and sectors
- S8
- S6 & S7 Interpolation
- S9 & S10 Interpolation
- W3 (East): The software covering 45° to 135°, and sectors
- S5
- S3 & S4 Interpolation
- S6 & S7 Interpolation
- W4 (North): The software covering 315° to 45°, and sectors
- S2
- S12 & S1 Interpolation
- S3 & S4 Interpolation
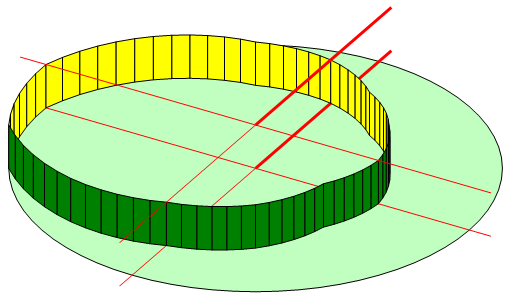
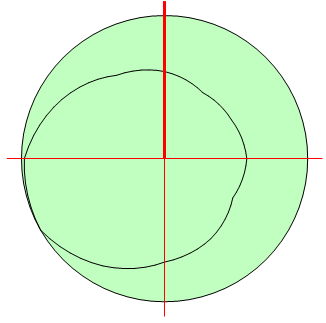
Once the sectors are grouped into their respective quadrants, the software evaluates the calculated peak velocity pressures (qp) within those sectors. For each of the 4 building faces, the governing design wind pressure is determined by extracting the absolute maximum peak velocity pressure from its constituent sectors.
Interpolation between Adjacent Sections
The values indicated are not purely the 'worst case' for the three segments in that quadrant; they also take into account the two adjacent sectors on either side and perform interpolation between them. Thus, for example on the yellow rather than limiting the analysis to S7-S9, it also includes the values from neighboring sectors S6 and S10.
Example,
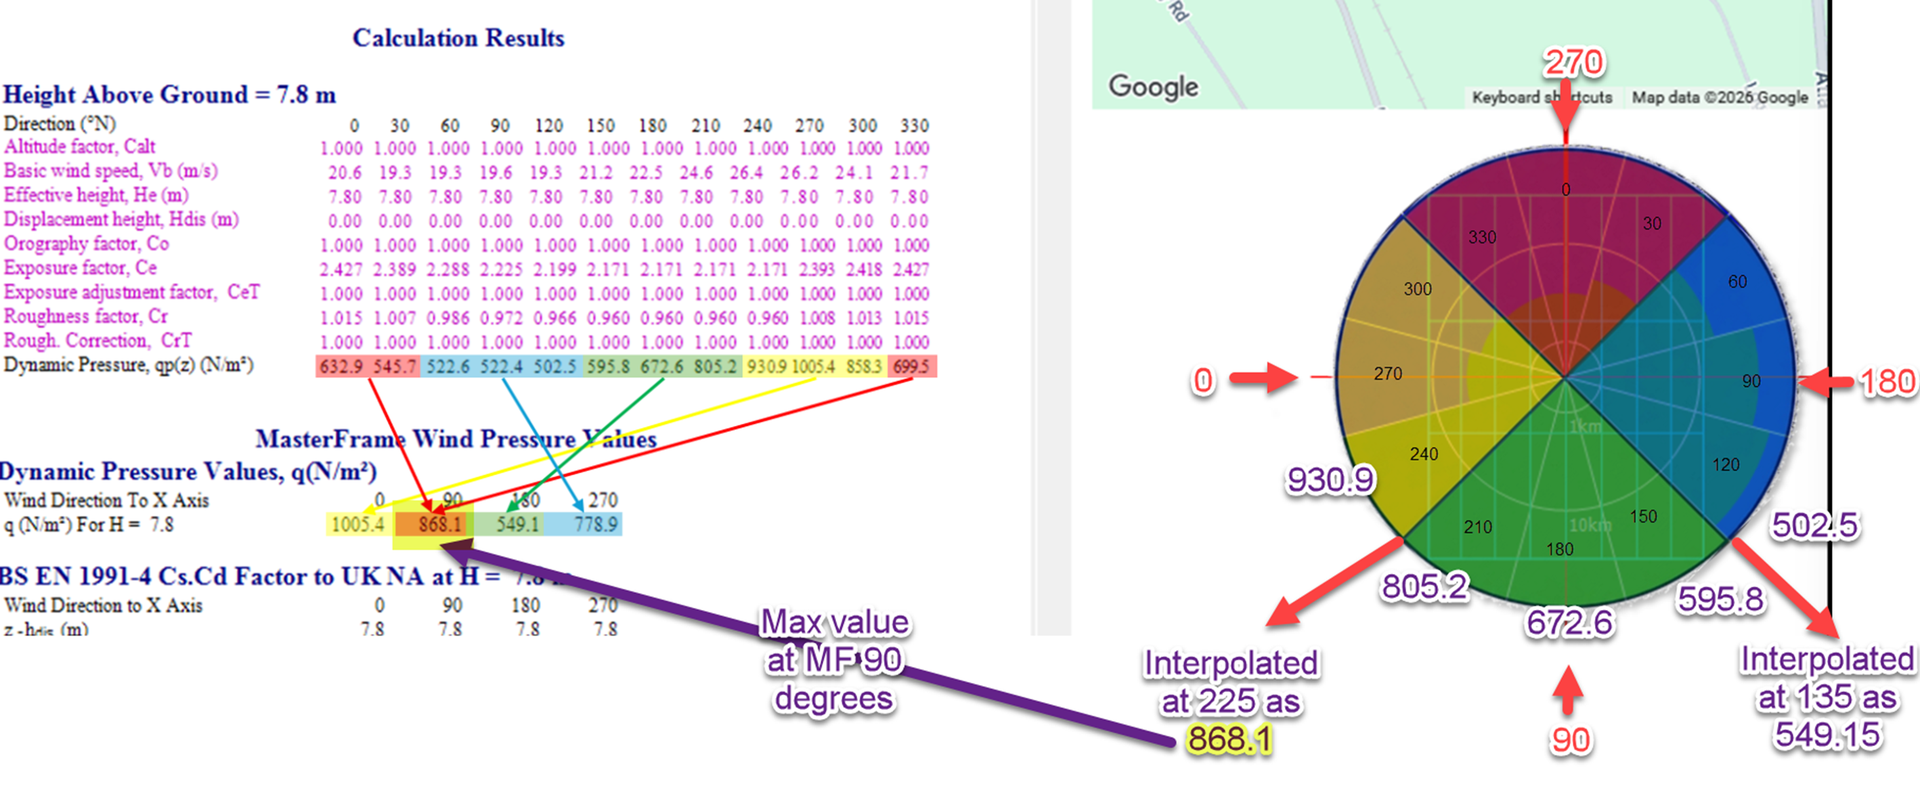
If the building is rotated, the sector mapping shifts dynamically to match the building faces.
Example Calculation
For each wind direction (W1-W4) the software takes the maximum of:
- 0 deg actual wind direction
- 30deg left of wind direction
- 30deg right of wind direction
- 45deg left of wind direction (average of 30deg and 60deg left of wind direction)
- 45deg right of wind direction (average of 30deg and 60deg right of wind direction)
This provides five possible wind pressures from which the maximum value is chosen, and provides a full 90deg sweep of the wind quadrant.
For the given example (above).
W1 (N/m2)
270: 1005.4
300: 858.3
240: 930.9
315: (858.3+699.5)/2 = 778.9
225: (805.2+930.9)/2 = 868.1
Max: 1005.4 (@270)
W2 (N/m2)
180: 672.6
210: 805.2
150: 595.8
225: (805.2+930.9)/2 = 868.1
135: (595.8+502.5)/2 = 549.1
Max: 868.1 (@225)
W3 (N/m2)
90: 522.4
120: 502.5
60: 522.6
135: (595.8+502.5)/2 = 549.1
45: (545.7+522.6)/2 = 534.1
Max: 549.1 (@135)
W4 (N/m2)
0: 632.9
30: 545.7
330: 699.5
45: (545.7+522.6)/2 = 534.1
315: (858.3+699.5)/2 = 778.9
Max: 778.9 (@315)