Managing Peaks and Singularities from Concentrated Loads in MasterFrame
Managing peak stresses is a crucial aspect of interpreting Finite Element (FE) analysis results, particularly when designing reinforced concrete slabs. This issue is common to all FE software because the standard linear-elastic analysis methods struggle to accurately model the forces around point restraints or concentrated loads, leading to computational singularities or theoretically infinite stresses.
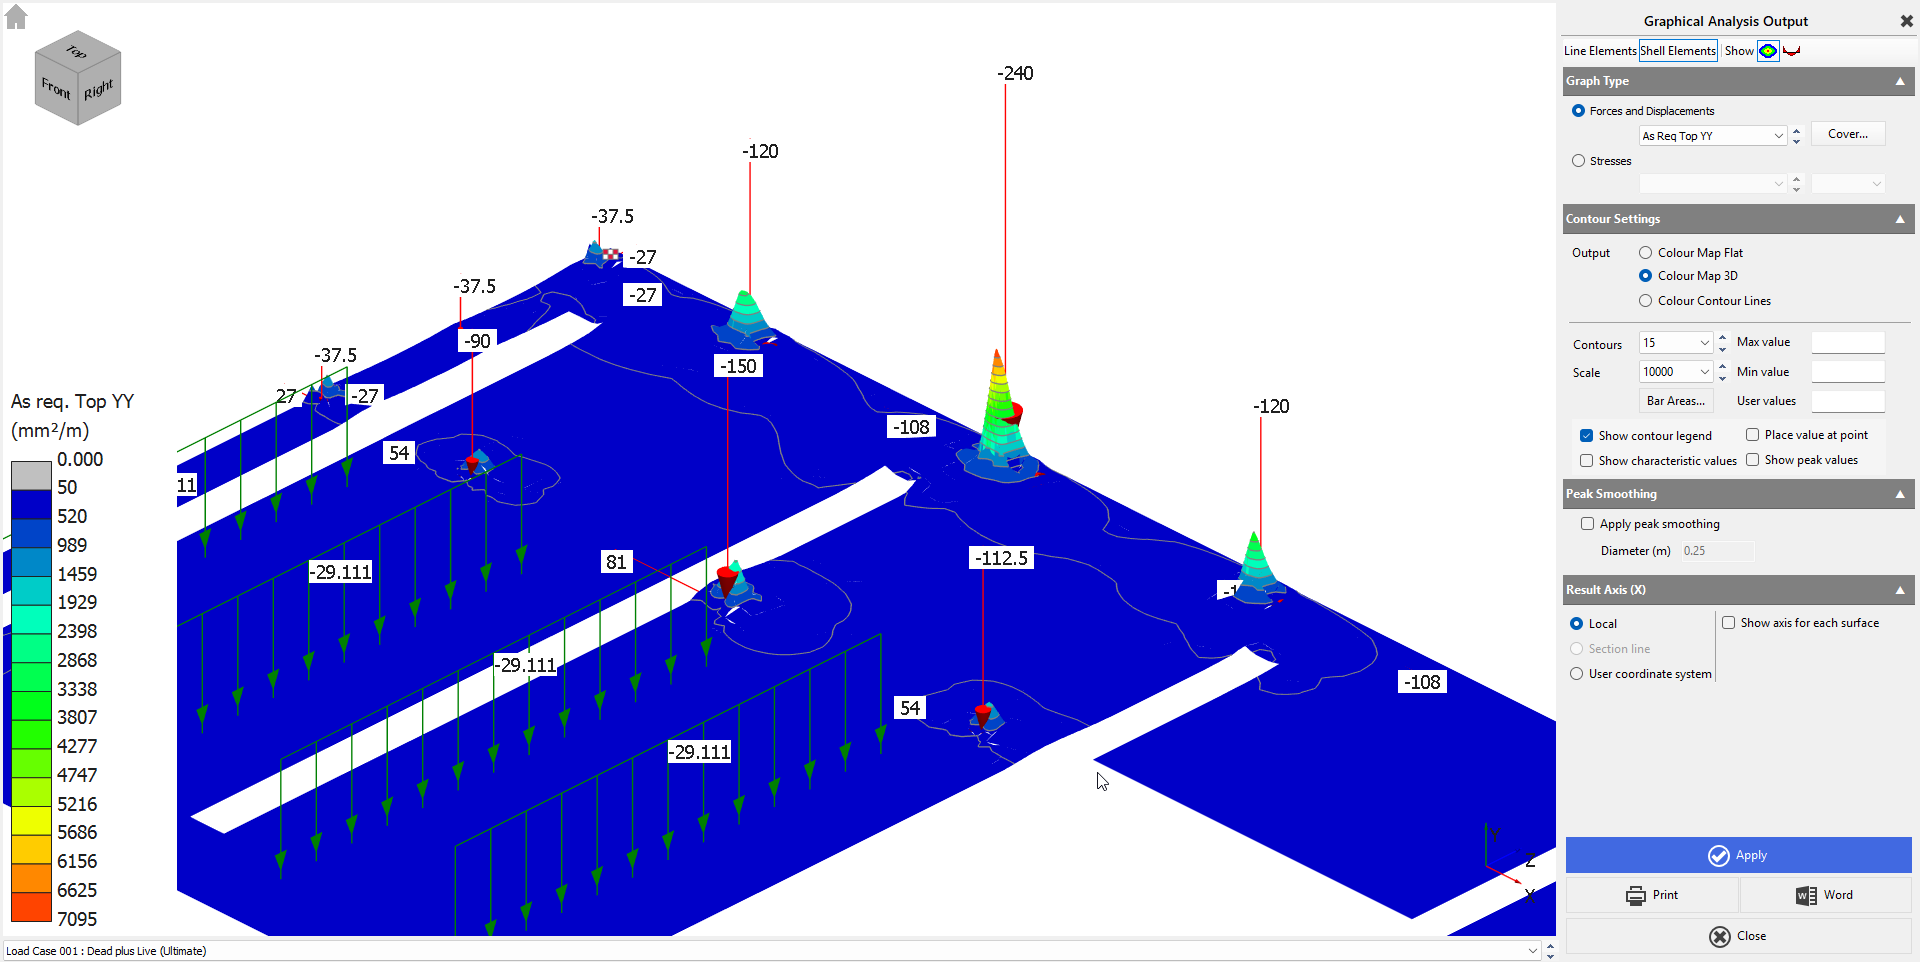
In reality, the high localised stresses calculated by the FE model do not exist in the concrete because the material cracks and the reinforcement yields locally, distributing the forces to adjacent areas. Therefore, engineers must exercise judgment and use techniques to average or smooth these peaks rather than designing reinforcement for the peak moment itself.
Managing Peaks in MasterFrame FE Analysis
MasterFrame provides tools for managing peaks, especially for concrete design, using both contour outputs and section line diagrams:
1. Peak Smoothing for Contour Outputs
Peak smoothing is a feature available when viewing FE results graphically, such as contour plots,.
- Mechanism: Peak smoothing addresses high peak values that occur due to a singularity, where a force or restraint is theoretically applied at a point with no size. The software defines a radius around the calculated peak and uses the maximum result value found at the perimeter of this radius to represent the results within the defined perimeter.
- Application: When the peak is smoothed, the resulting contours inside the peak perimeter are used for visualization and design interpretation.
- Limitation: Care must be taken to select an appropriate radius. Notably, peak smoothing is not effective where column/wall stiff regions have already been applied because the mesh stiffness has already been modified to account for the stiffness of the intersecting members. If no peak radius is defined and supporting column is identified below a slab peak point, the smaller dimension of the column is used.
2. Averaging Strips with Section Line Diagrams
In the MasterFrame Finite Element module, Section Line Diagrams allow users to extract and plot result values along a defined line, rectangle, or circle within the FE surface.
- Averaging Strips: These diagrams can be paired with an "average strip" width, which integrates values across a band of the FE mesh. This integration effectively smooths out localised peaks to provide a more representative force distribution.
- Code Compliance: This technique aligns with the requirements of design codes like BS 8110 and Eurocode 2 for flat slabs, which specify averaging the bending moment over column and middle strips for reinforcement design. This method is advantageous for slabs with irregular geometry where fixed bay widths are not applicable.
Modelling Concentrated Loads: Point / Patch Loads vs. Modeled Columns
The way concentrated loads are modelled can significantly affect both the local stress distribution and the magnitude of peak FE forces.
| Modelling Method | Description | Resulting Stress Profile |
| FE Surface (Nodal) Point Loads | A load defined directly on the FE surface using Load Points (LPs). These are specified in kilonewtons (kN). | Applying a large point load directly can result in infinite stresses (singularities) and very high localised peaks in bending moment and shear force. If the point load does not coincide with a mesh node, it is distributed over the area of the associated finite element. |
Patch Area Loads | A pressure applied over a defined finite area of the FE surface. | Patch loads generally produce a smoother local stress distribution, as the loaded area deforms with the surrounding slab. They do not create a stiff bearing region and therefore do not usually generate the same local stress concentrations as a modelled column. |
| Loads from Modelled Concrete 'Stub' Columns | Loads originating from columns treated as 1D line (concrete) elements connected to the slab (2D FE surface). | Where the column is treated as a stiff region, the slab is locally stiffened over the column footprint. This typically produces higher local stress concentrations around the perimeter of the support area and excludes slab results from within the stiff region itself. |
As an alternative to applying column or pile reactions as point loads, users may model these supports as short stub concrete columns connected to the FE slab, with column/slab stiff regions enabled in the meshing options. This allows the load to be transferred over a finite bearing area consistent with the support footprint.
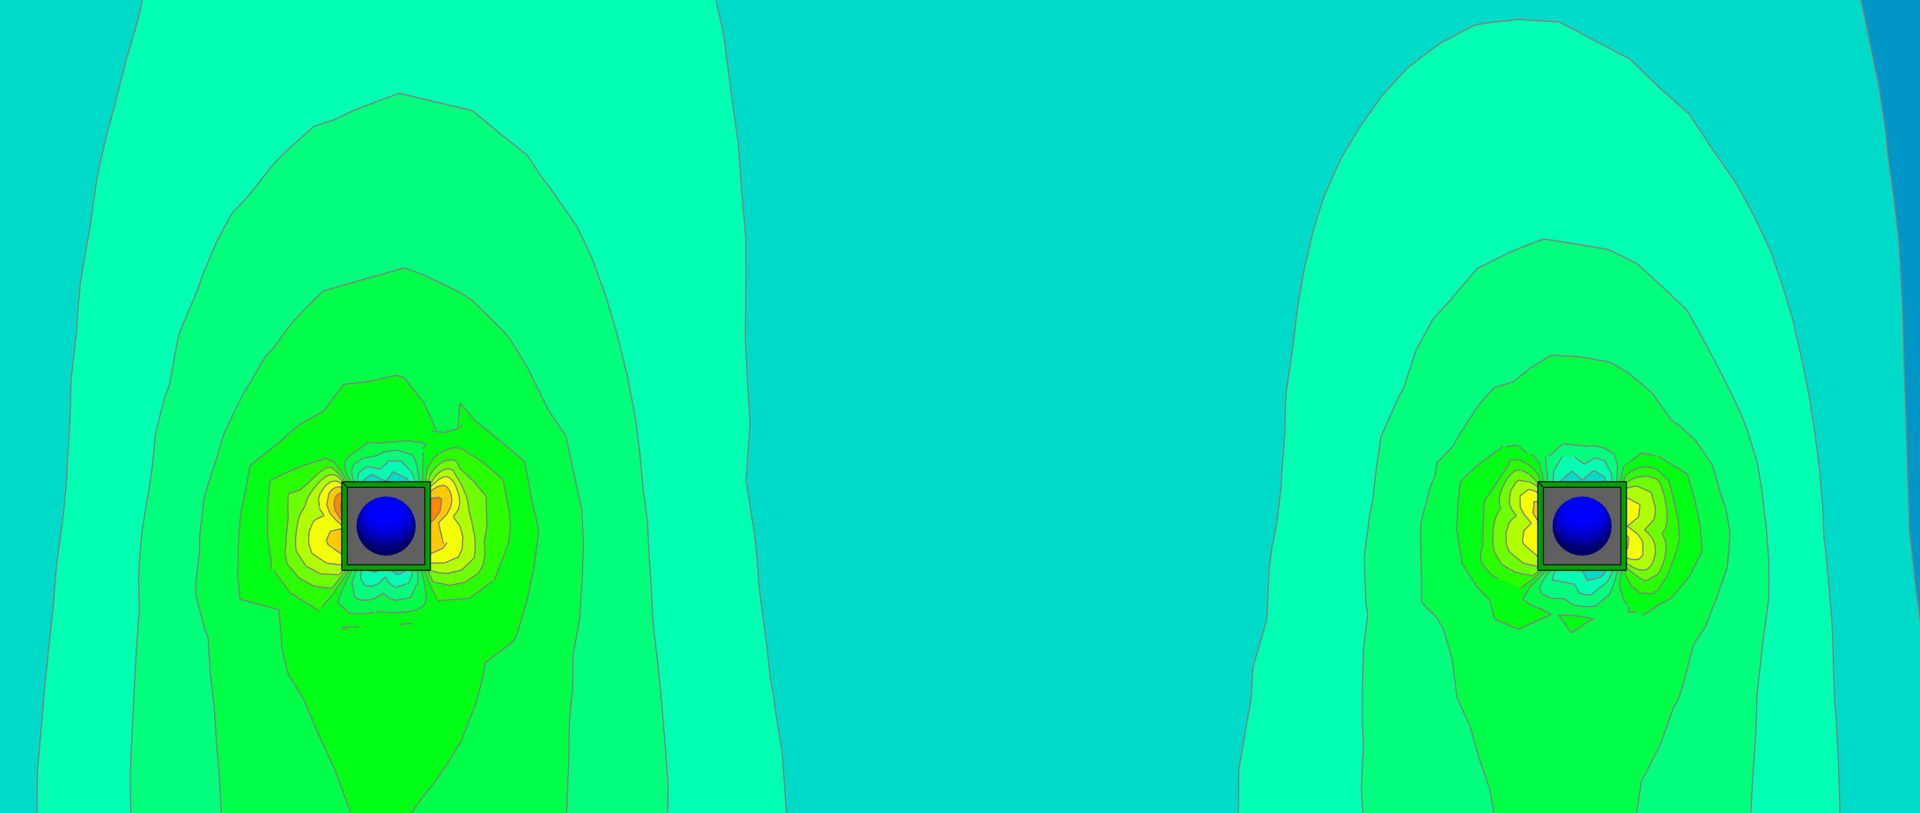
However, this should not be regarded as equivalent to a simple patch load. A patch area load applies pressure to the slab and deforms with it, whereas a modelled column with a stiff region introduces local stiffness effects and can produce much higher localised stresses around the column perimeter. The magnitude of these peaks will also depend on the mesh density and topology.

For this reason, local peak values around concentrated loads should be interpreted with care. In many cases, design should be based on a more representative average over an appropriate strip, width, or control region, rather than the single highest nodal or elemental peak.
Advantages of Introducing Columns and Stiff Regions
Introducing columns as structural line elements with their cross-sectional dimensions, even if initially as short stub columns to capture the dimensions, provides several analytical and design advantages through features available in the MasterFrame FE and the Concrete Slab and Wall Design modules:
1. Managing Peaks with Stiff Regions
- Improved Stiffness Representation: Columns and walls interact with the slab over a cross-sectional area, not just a single point. By enabling Slab Stiff Column/Wall Mesh Regions, the software modifies the FE mesh over the actual footprint of the intersecting column.
- Peak Mitigation: This modification adjusts the stiffness of the FE elements within the column area, which better represents the 2D nature of the intersection and effectively mitigates the singularity problem, leading to more realistic stress distributions.
- Deflection Control: The area of the columns is modelled as relatively stiff elements, which reduces the calculated deflections compared with a point support.
2. Accurate Linear and Punching Shear Checks
The use of the Concrete Slab and Wall Design module relies on accurate force distribution provided by well-modeled supports for checks that are often the governing criteria for flat slabs.
- Punching Shear Checks: When the column dimensions are accurately included in the model, the software can determine the punching shear perimeters. A key advantage is the ability to select the FE Shear Forces Design Force Method (instead of the default empirical Code Method), which uses the shear stresses directly from the FE analysis results, allowing for a more refined punching shear check. This is vital for complex slabs or transfer structures.
- Linear Shear Checks: The interaction of a full 3D frame model (including columns) with the slab allows for proper linear shear checks. This is often carried out using the Section Line Diagrams combined with averaging strips to sample the shear force appropriately for linear shear design (e.g., assessing shear force at a distance of 1D from the support face, as may be required in transfer zones).
By incorporating the columns (1D elements) and utilizing their stiffness and cross-sectional area information (via stiff regions), the design process moves beyond conservative assumptions required by point supports and enables sophisticated, code-based checks within the software.
Analogy: Managing singularities in FE analysis is like trying to measure the force exerted by a sharp needle pressing into a soft material. If you model the needle as a single mathematical point, the calculated pressure is infinite. To get a useful measurement, you must either average the pressure across a realistic area (like using averaging strips) or model the actual finite stiffness and size of the needle tip (like introducing stiff regions representing the column's cross-section), thereby distributing the load and providing a practical, finite result.