Graphical Analysis Results
MasterFrame has powerful reporting tools for viewing & printing the graphical results.
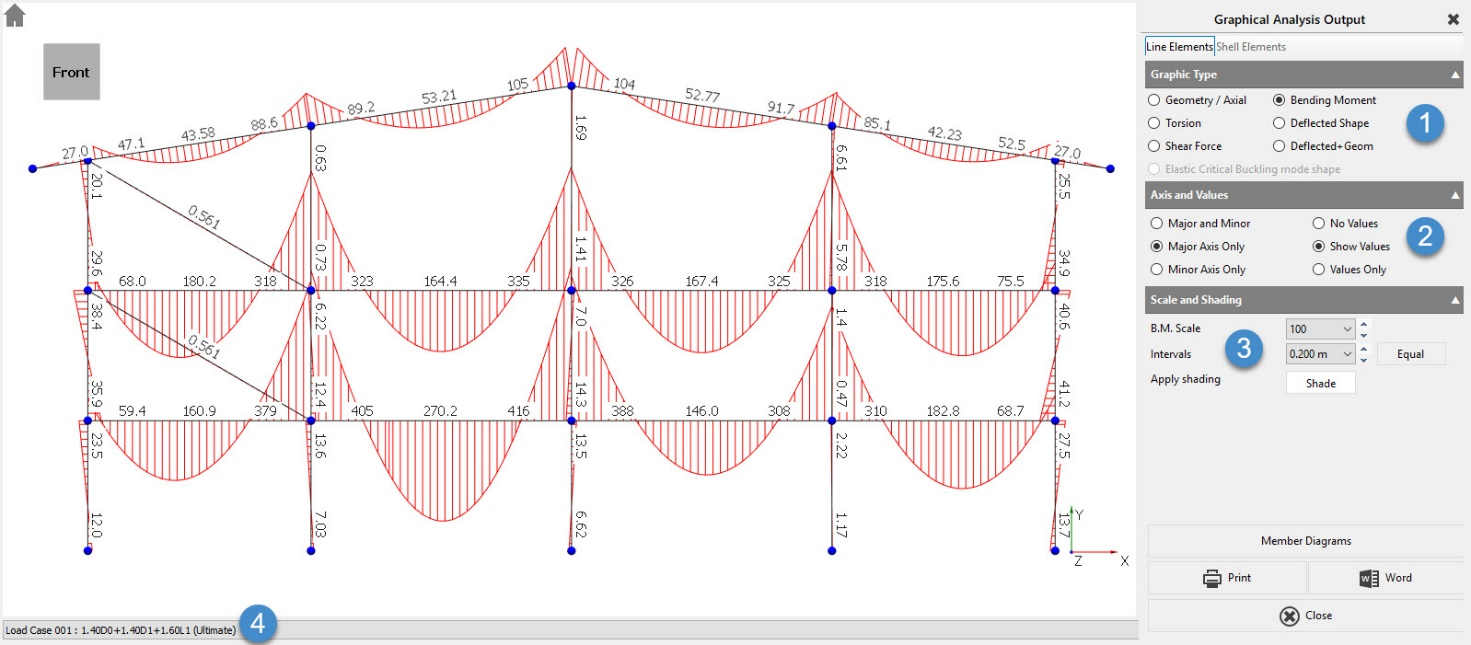
The screen is split into 4 different settings areas.
- Graphic Type
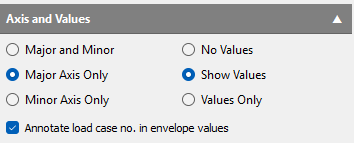
- Axis & Values
- Scale and Shading &
- Loading case
For each Graphic Type, the Axis, Values and Scales change as follows
Geometry/Axial
Show Values displays the Axial Force in each member in kN. For non-uniform axial load distribution, the value is annotated at each physical member end.
End values are written away from the end of the member to avoid clashing with other members and values.
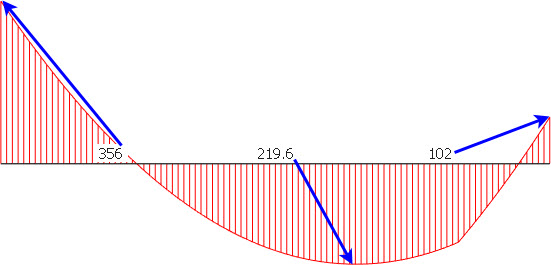
Shear Force
Show Values displays the Shear Force at each physical end of the member in kN.
The diagram is drawn as a scale in m. So, a 75 kN shear would be drawn 1.5 m high at a scale of 50 kN per metre.
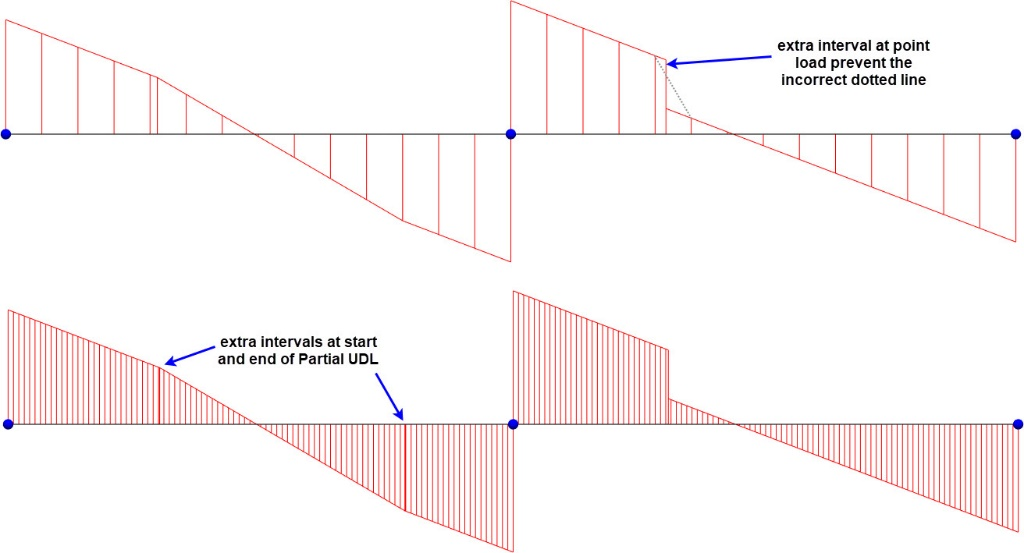
Intervals sets the number of intervals the diagram is drawn at and is measured in meters. MasterFrame will also add extra interval points at distinct changes in loading.
Torsion
Show Values displays the Torsion at each end of the member in kNm.
Scale is X kNm per metre.
Bending Moment
Show Values displays the Bending Moment at each end of the member in kNm. Where there is an in-span peak moment this value is also given, but it’s value is written at the centre of the span, irrespective of its location.
Deflected Shape
Displays the deflected shape with the deflections magnified.
No values can be displayed.
Deflected + Geom
This is much more flexible than the Deflected Shape option.
There are 2 types of deflection values.
Nodal deflection
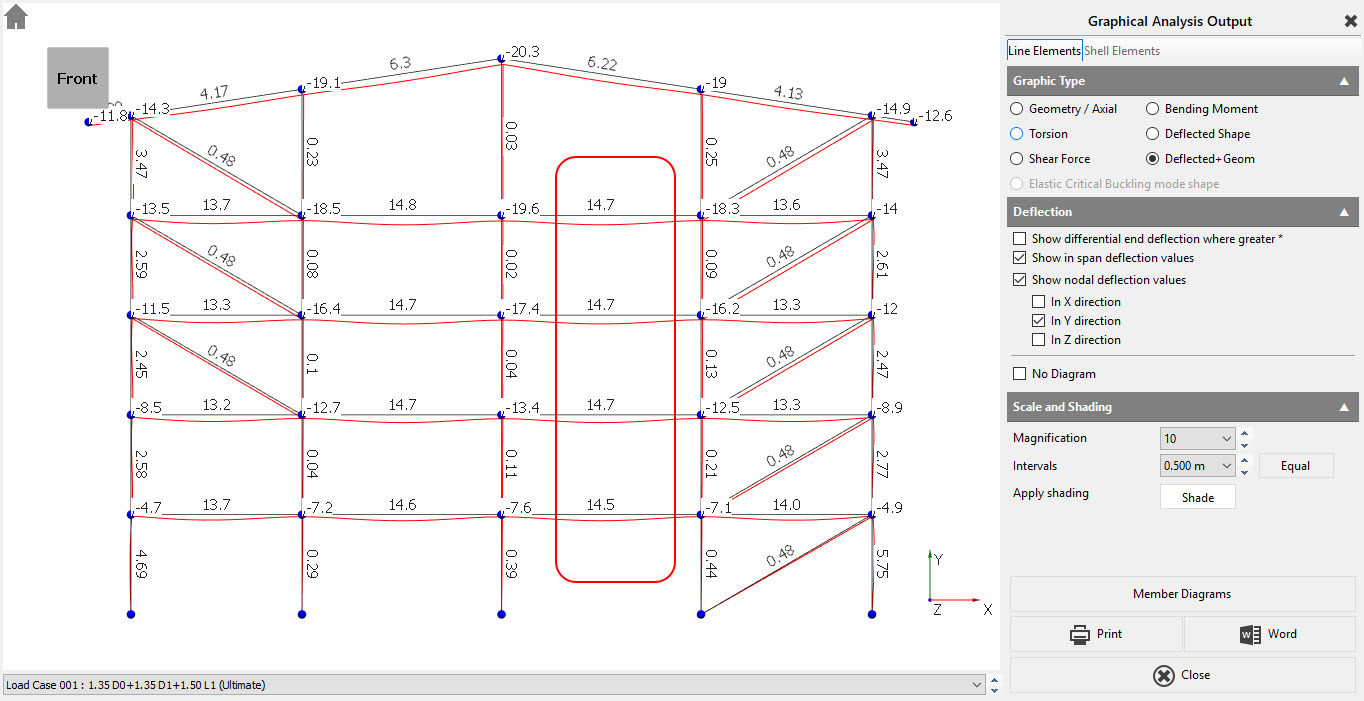
Nodal deflection is easy to understand. It is the global deflection of the node. The nodal deflection increases on the middle column as you move up, floor by floor. This is due to the columns compressing.
In-Span deflection
The highlighted in-span deflections do not change much as they are a measure of the curvature of the beam. On the fourth floor, the beam is not worried that the two columns have compressed 19 mm, only that the beam gives 14.7 mm of in span deflection. This is the value you use for your span/360 deflection check.
For further information on the nodal and member and in-span deflections see this technical note.
Timber Deflections in EuroCode - see the following technical note on timber deflections to EN 1995-1-1:2004 + A1-2008. This relates to the final deflection of a timber beam designed with loading cases according to EN 1990.
Cantilevers and Sway Deflection
In cases such as cantilevers and column sway we need to know, not the in-span deflection, but the differential deflection between the 2 ends. This can be controlled using the 'Show Differential end deflection where greater *' option. When differential end type deflections are shown the value annotated has an '*' suffix.
For further information on cantilevers and their deflections see the technical note on Cantilever Deflections.

Member diagrams
The Member Diagrams button allows you to view all the forces on a single member.
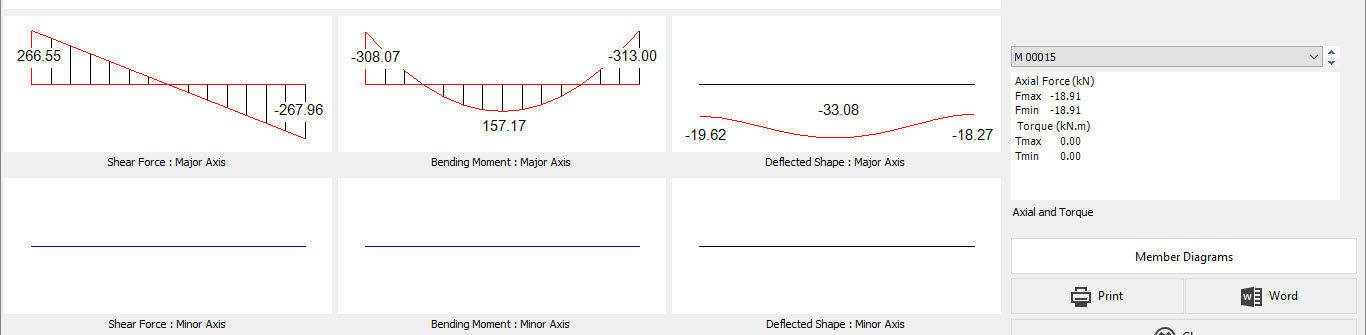
The third span, fourth floor beam gives you the values above.
Note the deflection is now the global deflection 33.08 mm = 14.7 + (19.62+18.27)/2 = 33.65 mm approximately. The discrepancy is because the maximum in-span is not at the mid-point.
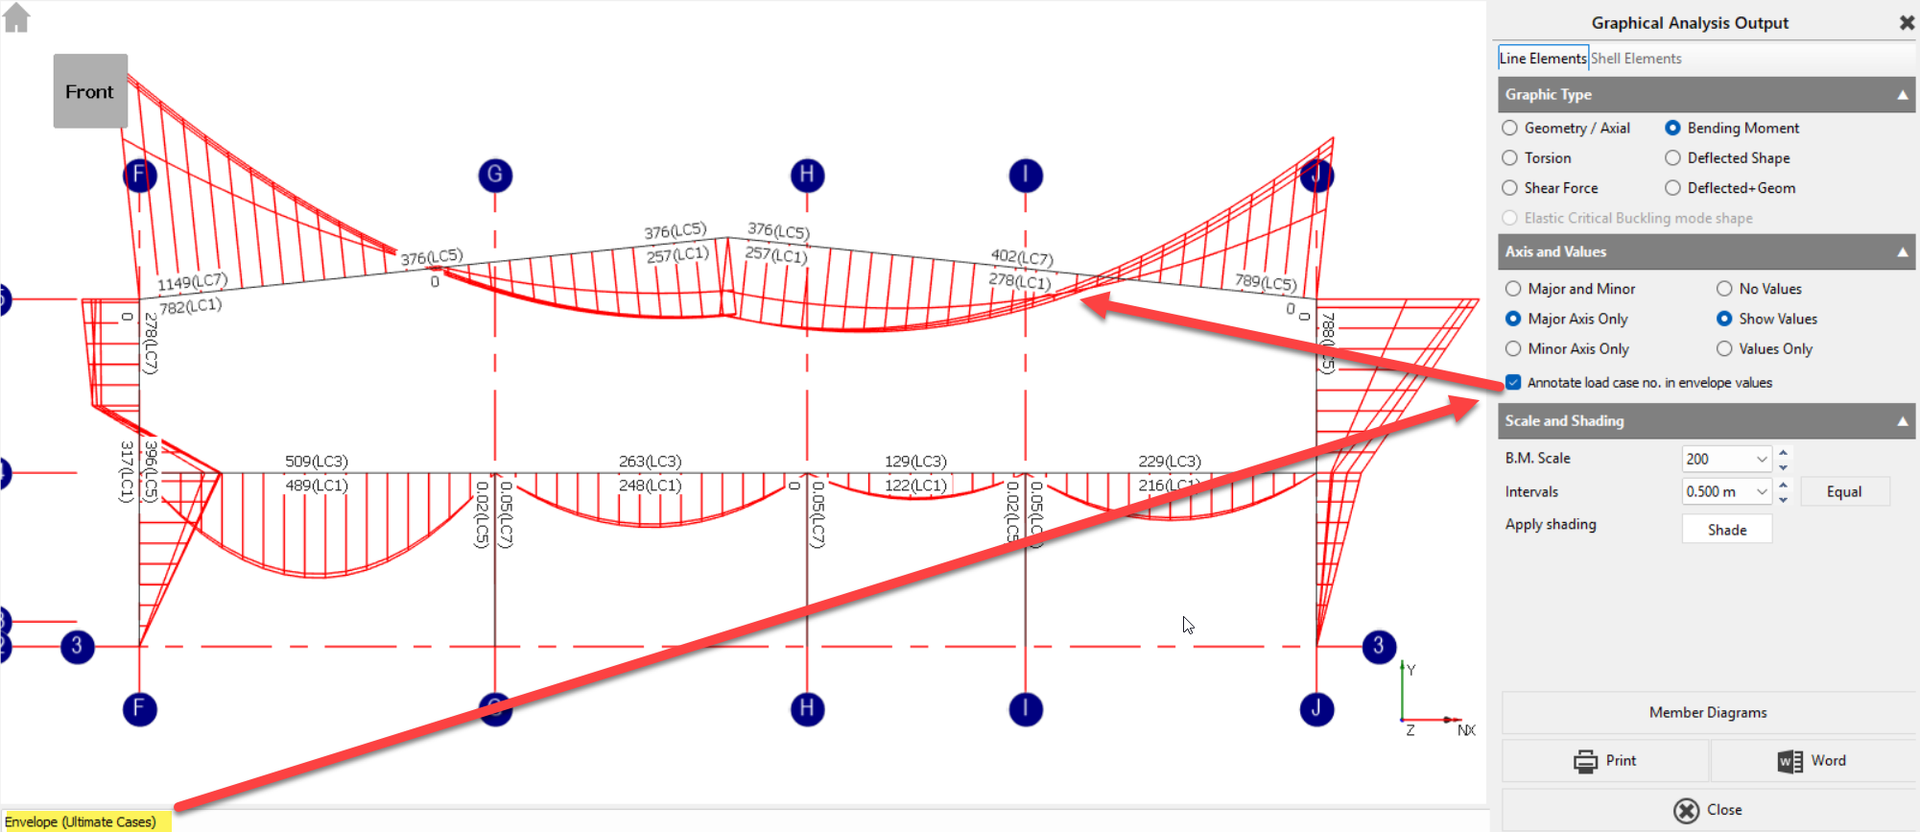
Envelope Cases
For the graphical analysis output of envelope cases, an option allowing users to annotate the associated load case number attributed to the maximum and minimum envelope values.
Printing Graphical results
This is very similar to Tabular Results except you can change scales, zoom & pan in the preview.